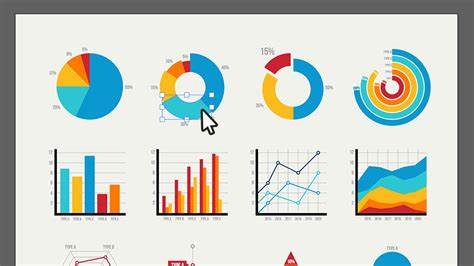
In the era of big data, effectively visualizing complex datasets is crucial for understanding trends, identifying patterns, and making informed decisions. Today, a groundbreaking innovation is reshaping the way we visualize data: Artificial Intelligence (AI)-generated dynamic data graphs. These intelligent tools, powered by advanced algorithms and machine learning techniques, offer unparalleled capabilities for creating dynamic and interactive data visualizations that adapt to changing data inputs in real-time. In this article, we delve into the transformative potential of AI-generated dynamic data graphs, uncovering their benefits, applications, and how they’re revolutionizing data visualization practices across industries.
Elevating Data Analysis with Real-Time Insights:
Real-Time Data Monitoring:
AI-generated dynamic data graphs enable real-time data monitoring and analysis, allowing users to track key metrics, detect anomalies, and uncover insights as they unfold. By continuously updating and visualizing data in response to changing inputs, AI algorithms provide users with instant feedback and actionable insights, empowering them to make timely decisions and respond proactively to emerging trends and patterns.
Predictive Analytics:
AI-generated dynamic data graphs leverage predictive analytics models to forecast future trends and outcomes based on historical data patterns. By analyzing historical data trends and incorporating predictive algorithms, AI algorithms can generate forecasts and projections that help users anticipate changes, identify opportunities, and mitigate risks before they occur, enabling proactive decision-making and strategic planning.
Interactive Data Exploration:
AI-generated dynamic data graphs offer interactive data exploration capabilities, allowing users to interact with and manipulate data visualizations in real-time. Whether it’s zooming in on specific data points, filtering data by criteria, or drilling down into detailed insights, interactive data exploration tools empower users to dive deeper into their data, uncover hidden patterns, and gain a deeper understanding of complex datasets, fostering exploration, discovery, and innovation.
Application of AI-Generated Dynamic Data Graphs:
Financial Markets:
AI-generated dynamic data graphs are transforming financial markets by providing traders and investors with real-time insights and predictive analytics capabilities. Whether it’s monitoring stock prices, analyzing market trends, or predicting future market movements, AI-powered dynamic data graphs enable traders and investors to make informed decisions, optimize trading strategies, and maximize returns in a rapidly changing market environment.
Healthcare and Life Sciences:
AI-generated dynamic data graphs are revolutionizing healthcare and life sciences by providing researchers and healthcare providers with real-time insights into patient data, clinical trials, and medical research. Whether it’s tracking disease outbreaks, monitoring patient vitals, or analyzing genomic data, AI-powered dynamic data graphs enable healthcare professionals to make data-driven decisions, improve patient outcomes, and accelerate medical research and innovation.
Supply Chain and Logistics:
AI-generated dynamic data graphs are reshaping supply chain and logistics operations by providing businesses with real-time visibility into inventory levels, shipment status, and supply chain performance metrics. Whether it’s optimizing inventory levels, identifying bottlenecks, or predicting delivery delays, AI-powered dynamic data graphs enable businesses to improve operational efficiency, reduce costs, and enhance customer satisfaction by ensuring timely and reliable delivery of goods and services.
Conclusion:
AI-generated dynamic data graphs represent a paradigm shift in the world of data visualization, offering unparalleled capabilities for real-time data monitoring, predictive analytics, and interactive data exploration. As businesses, researchers, and organizations continue to embrace the power of AI in data visualization, the potential for innovation, efficiency, and strategic decision-making is limitless. By harnessing the transformative capabilities of AI algorithms, users can unlock new insights, uncover hidden patterns, and drive meaningful outcomes that propel their organizations forward in a rapidly evolving digital landscape.


